This is a blog post from the past. Originally written at 2021-11-18.
Simple yet elegant, K-means is a clustering method used by almost every researching area at least once or twice. Just tell it how many clusters we need, and it magically does it for us. How nice!
But now it’s time for us to weave the magic. Suppose we have a bunch of random points, how does it work behind the scenes, partitioning stuffs just like that? Well, let’s see…
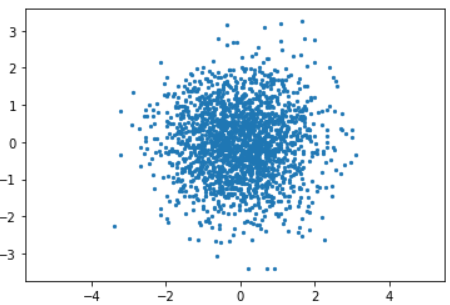
1. Choose \(k\) random points
That’s right. We define the center of our said clusters randomly at the very beginning.
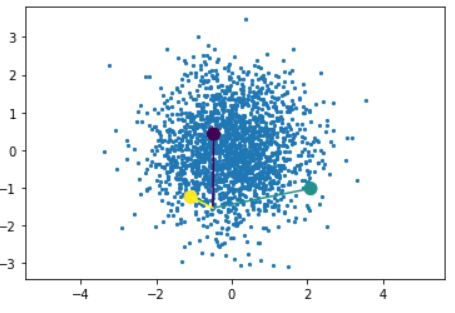
Sometimes those cluster centers – or centroids as we call them – can be incredibly close to each other, but that’s OK. The location is not important – they will be corrected in time.
As shown in the graph, I have picked k = 3, which means 3 clusters are gonna be partitioned after the K-means.
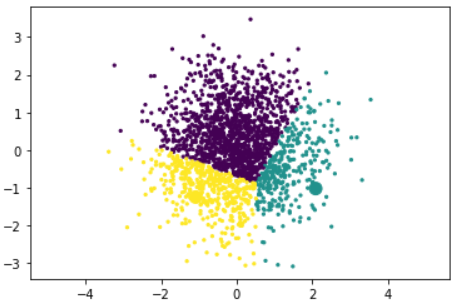
2. For each point above, pick the cluster whose centroid’s distance is closest to the said point itself
Assume there’s a point A. The distance between A and the three centroids are pretty obvious in this image – obviously it will go with cluster yellow, and that’s exactly what happens.
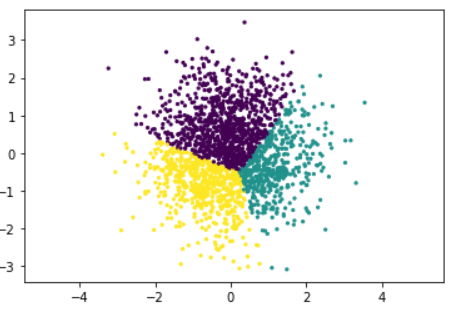
After the whole partition thingy, the graph will be separated into 3 clusters, albeit very imprecise, because cluster purple obviously owns a thick chunk here, and we don’t want that.
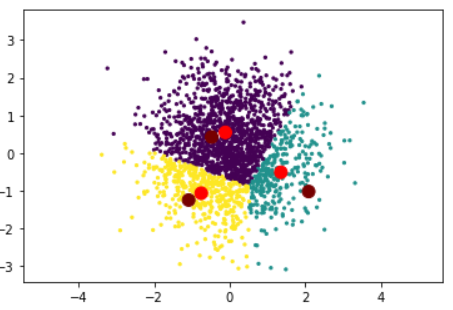
3. Update the centroids and set them as the real center of those points belonging to their cluster
To put this another way, we find the center among all the purple points now, and set it as our new purple centroid. And hey, look at that! Purple’s centroid is shifting to the right! (Dark red indicates purple’s old centroid.)
The same goes for yellow & teal – so after a loop, everyone’s centroid shifts to their new position.
4. Back to step 2
With new centroids in our hands, we can perform the partition again. And this time, the results are gonna be different.
It’s not that different – but still obvious – you can see the point colors are more evenly spread out now. If you are satisfied with the result you have, you can just call it. If you are not, you can continue this endless cycle. Most scientists however, calls it when they detect no change or just a very tiny, ignorable amount of change in those centroids (because it’s probably not gonna change any further).
Profit!
And there you have it: the K-means clustering algorithm. All the cool kids are using it, it’s easy to understand, and there are colors and stuffs. Fancy!
Further Readings
- DBSCAN - Wikipedia
- OPTICS algorithm - Wikipedia
- Mean shift - Wikipedia
- Mixture Model - Wikipedia: K-means is a special case of Gaussian Mixture Model (GMM).
Or, if you are more into complex networks: Spectral clustering – Wikipedia
Comments